Business Intelligence Reporting
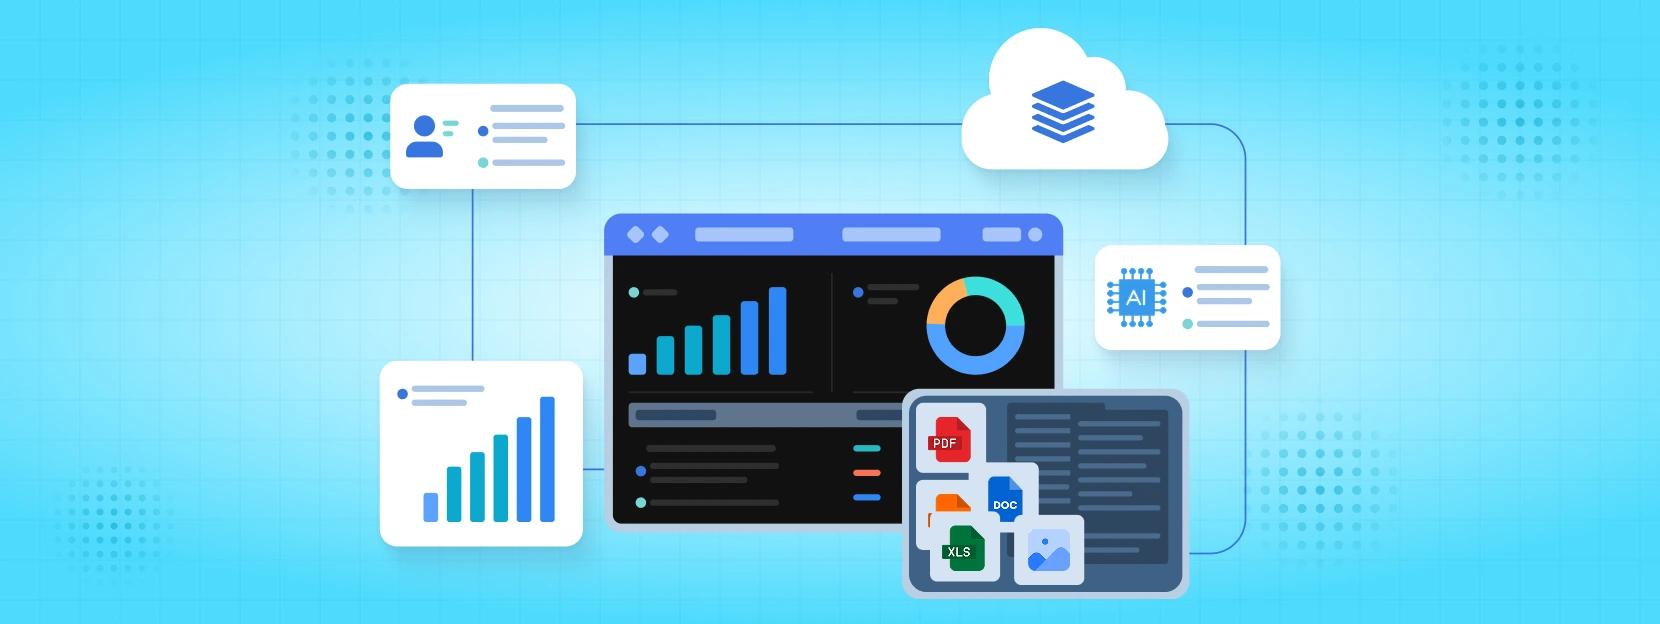
Turn complex, fragmented enterprise data into clear, actionable decision-making tools with modern business intelligence reporting services. As a trusted business intelligence and reporting provider, we help organizations streamline bi reporting, build automated dashboards, and deploy scalable business intelligence solutions. Our end-to-end bi for business solutions integrate directly with your tech stack to deliver real-time visual clarity and executive-ready insights across your enterprise.




25,000+
Projects
9+ years
Experience
ISO
Certified
15,000+
Satisfied Clients
99.99%
Accuracy
Custom Business Intelligence Solutions for Data-Driven Growth
Our business intelligence reporting services streamline complex operational data into dynamic, executive-ready analytics. By leveraging modern business intelligence solutions, we replace manual spreadsheet workflows with automated, real-time data pipelines that surface clear operational trends. From C-suite performance metrics to team-level operational reporting, our tailored bi reporting frameworks enable faster decision-making and cross-departmental alignment.
Whether your goal is to transition away from legacy reporting systems, scale existing analytics infrastructure, or implement centralized bi for business, our end-to-end business intelligence and reporting capabilities connect directly to your data ecosystem to support your strategic goals.


Comprehensive Business Intelligence & Reporting Services
We design and deploy modern business intelligence reporting services that transform raw data streams into automated, decision-ready reporting systems across your organization.
Establish scalable business intelligence solutions that unify data from your CRM, ERP, data warehouse, and third-party tools into a single source of truth. Eliminate manual data extraction and maintain uniform KPI definitions across all business units.
Streamline bi reporting through interactive, self-service dashboards tailored to specific operational roles. Give teams instant visibility into real-time operational performance, revenue metrics, and high-priority trends without reliance on custom SQL requests.
Deploy robust bi for business frameworks structured for executives, directors, and operational leaders. We transform complex metrics into clear, high-level summaries that pinpoint operational gaps and highlight growth opportunities.
Upgrade outdated spreadsheet models and fragmented tools into dynamic business intelligence and reporting environments across Power BI, Tableau, or Looker to accelerate data refresh rates and lower reporting overhead.
How We Execute Business Intelligence & Reporting Projects
We utilize a proven, step-by-step methodology to transform your raw data assets into dynamic, automated reporting systems.
- Data Audit & KPI Alignment: We start by evaluating your existing data architecture, defining core metrics, and mapping out executive and departmental reporting goals to align with your business objectives.
- Data Pipeline & Architecture Setup: Our engineers connect, consolidate, and clean data streams from across your databases and SaaS platforms to establish a centralized foundation for reliable bi reporting.
- Data Modeling & Metric Standardisation: We construct robust semantic models and uniform calculation logic to ensure your business intelligence and reporting feeds return consistent, accurate figures across every department.
- Custom Report & Dashboard Engineering: Using leading platforms like Power BI, Tableau, or Looker, we design interactive visualization interfaces tailored for efficient, role-based bi for business usage.
- Performance Optimization & Validation: We stress-test query response times, verify data accuracy against source systems, and implement row-level security protocols to ensure enterprise-grade safety and speed.
- Deployment, Governance & Enablement: After launching your business intelligence solutions, we train your teams, document data governance rules, and establish automated schedule updates for long-term reporting independence.
BI Reporting Architectures Integrated with Your Data Stack
Effective reporting requires more than basic tables and charts. It demands clean data integration, high-performing pipelines, and tailored business intelligence reporting services aligned directly with your tech stack.
Our analytics engineers deliver robust business intelligence solutions across modern tools and frameworks:
- Enterprise BI Platforms: Power BI, Tableau, Looker, Qlik Sense
- Data Lakehouse & Warehouse Integrations: Snowflake, Google BigQuery, AWS Redshift, Databricks
- Custom Reporting & Web Frameworks: D3.js, Chart.js, Highcharts for embedded applications
- Automated ETL/ELT Pipelines: Fivetran, dbt, Airflow for seamless business intelligence and reporting updates
- Embedded BI Analytics: Direct dashboard integration into customer portals and SaaS products
- Self-Service BI Architecture: Scalable bi for business frameworks empowering non-technical users to build custom reports
- Operational Monitoring & Alerts: Real-time bi reporting models with automated KPI alerts and scheduled PDF/email distributions
- Mobile & Executive Dashboards: Responsive analytics designs tailored for C-suite decision-making on iOS and Android
Our focus isn’t just delivering reports—it is building an end-to-end reporting ecosystem that empowers your team with fast, accurate answers.
Enterprise BI Solutions Across Key Industries
Our business intelligence reporting services adapt to complex data ecosystems across diverse domain sectors, converting domain-specific operational metrics into clear management insights.
Professional Services
Billable utilization tracking, project profitability scorecards, client retention metrics, resource capacity forecasting, and practice-level bi reporting.
Property Management
Occupancy rate tracking, rental yield analytics, asset portfolio performance views, operational expense management, and tenant churn reporting powered by tailored business intelligence solutions.
Media & Streaming
Subscriber acquisition cost (SAC) analytics, content performance heatmaps, churn propensity tracking, and ad revenue performance feeds built with bi for business.
Energy & Utilities
Asset uptime tracking, consumption pattern reporting, grid efficiency analytics, regulatory compliance scorecards, and environmental metric business intelligence and reporting.
Insurance & Underwriting
Loss ratio analysis scorecards, claim processing turnaround heatmaps, policy renewal tracking, and risk pool profitability dashboards.
EdTech & Higher Education
Student retention & engagement analytics, program performance metrics, enrollment pipeline forecasting, and institutional resource allocation reporting.
Client Experiences


InputiX completely modernized how our leadership team tracks daily performance. Seeking reliable business intelligence reporting services, their team built automated, central reporting pipelines that eliminated our weekly spreadsheet overhead. The real-time bi reporting dashboards allow our executives to monitor KPIs instantly, making them an invaluable partner for business intelligence and reporting solutions.
Thames E.,Head of Operations, US Tech Enterprise
Frequently Asked Questions (FAQs)
Explore Business Intelligence Reporting Services With InputiX
Take the next step toward making your business metrics clearer, automated, and operational. From dynamic reporting dashboards to real-time executive analytics, InputiX helps US enterprise leaders transform complex operational datasets into actionable leadership insights. Whether you need end-to-end implementation for a dedicated analytics project or ongoing optimization for your bi reporting infrastructure, our team builds tailored business intelligence solutions aligned with your technical ecosystem and revenue goals.